Annals of Mathematics and Physics
Optimizing Dijkstra's Algorithm for Managing Urban Traffic Using Simulation of Urban Mobility (Sumo) Software
Amenah Sufyan Mhmood Thabet and Ahmet Zengin*
Cite this as
Mhmood Thabet AS, Zengin A. Optimizing Dijkstra's Algorithm for Managing Urban Traffic Using Simulation of Urban Mobility (Sumo) Software. Ann Math Phys. 2024;7(2):206-213. DOI: 10.17352/amp.000124Copyright Licence
© 2024 Mhmood Thabet AS, et al. This is an open-access article distributed under the terms of the Creative Commons Attribution License, which permits unrestricted use, distribution, and reproduction in any medium, provided the original author and source are credited.Among the challenges of urbanization is traffic management as a measure of growth and progress. Recent population growth has resulted in a significant increase in vehicles, causing traffic jams that are challenging for the existing transportation networks. This congestion affects other services, including public transit, airports, road maintenance, and pollution caused by emissions of CO2 and other gases. Furthermore, it doubles the amount of fuel used. This has negative consequences for society as well as economic losses. This paper focuses on an improved Dijkstra algorithm based on traffic congestion levels to address the above problems. Improved Dijkstra algorithm can provide (a) real data collected from the map via OpenStreetMap, (b) Add four features to SUMO(Simulation of Urban Mobility) simulator software (time period, rush-hour, number of vehicles, and routing algorithm), (c) it could know congestion level for roads (d) rerouting vehicles to avoid traffic congestion. Based on the simulation results and analysis presented in the paper, it was found that the proposed improved Dijkstra algorithm increased the performance of the road traffic flow by reducing the number of related vehicles in traffic congestion and average delay time for experiment scenarios.
Introduction
With the continuous progress of urbanization worldwide, the number of vehicles is still rising. The increased population has resulted in many worrying issues, such as traffic congestion, rising death rates in road incidents, increasing economic costs to drivers, and air pollution [1].
In the year 2022, the World Health Organization (WHO) published that annually, more than one million people die on the roads in the world and that 20 to 50 million suffer non-fatal injuries; economic costs associated with these crashes are estimated at between 1% and 3% of a country's local product. As per current estimates, around 90% of road accidents are caused by personal error, inattention, fatigue, or delayed reactions [2].
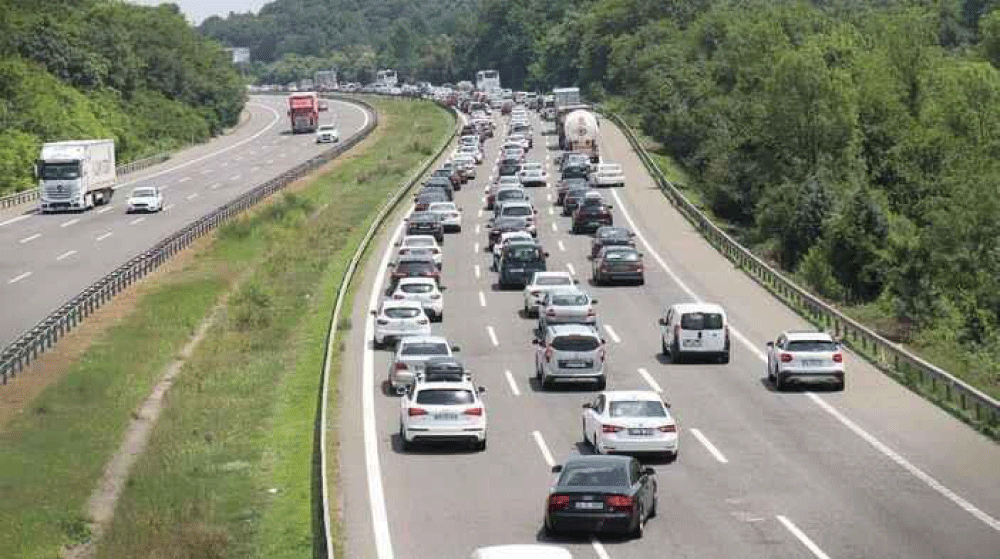
Fundamentally, it can characterize a road network condition that occurs daily during a particular time [3]. The United Kingdom Department of Transport announces that traffic congestion is a problematic concept to define due to its multi-dimension [4,5]. Various authors define traffic congestion differently from their points of view. In the context of travel time, a traffic jam occurs when many vehicles block the normal flow of traffic, causing travel time to increase [6]. We can define congestion by adding the inconvenience of interrupted traffic flow to the road user's cost [7]. As well as contributing to social depletion, traffic congestion causes air pollution, traffic accidents, noise pollution, and other problems that affect the environment [8,9]. Figure 1 shows the traffic jam in Sakarya City in Turkey.
It has classified traffic congestion into recurrent congestion and non-recurrent congestion. Recurrent congestion refers to a specific area where traffic congestion frequently occurs every day simultaneously, such as bad timing for a traffic light, frequent ramps, and special events like national occasions. The non-recurrent congestion can happen anywhere depending on the traffic capacity and road conditions that change with time, such as road accidents, bad weather conditions, and road works [3].
Assessing the level of traffic congestion is crucial for traffic management and control. There is no consistent and stable test for assessing traffic flow. Many studies have investigated urban traffic using a variety of metrics to measure traffic congestion.
Schrank, et al. designed the Road Congestion Index (RCI) to measure the severity of congestion in an area. In this study, daily vehicle miles traveled (DVMT), per weighted lane mile by road (highway or main artery) were compared with the expected total for the residential area in congestion situations. Values greater than 1.0 indicate regional congestion aggravated by highways (highways or arteries). Therefore, travelers find it difficult to set a measure for their past experience and to make predictions about future events [10].
Li Zhibin, et al. [11] proposed a Q-Learning-based Variable Speed Limit (VSL) control scheme to reduce the physical travel time of turn bottlenecks on highways by improving the Cell Transmission Model (CTM) for traffic modeling under VSL control. The simulation results show that the proposed strategy will be effective in reducing traffic congestion from regular traffic. Total travel time decreased by 49.34% and 21.84% under constant and variable demand, respectively.
Shubhangi M. Deshmukh, et al. suggest an alternative route for avoiding traffic congestion using smart devices embedded in cars, and a road authority can cover their entire road network without investing in infrastructure with the system. A system like that helps driving route planners, and navigation systems avoid traffic congestion. It also identifies the shortest way to travel to save time and fuel. It is an efficient, smart, reliable, and low-maintenance system [12].
Schafer, et al. use Global Positioning System (GPS) data to search for words or chapters and determine if the road will be congested if the average speed is below 10 km/h [13].
Terroso-Sáenz, et al. [14] propose using external data sources to detect traffic jams. For distributed traffic information systems, this architecture uses complex-event processing technology to detect congestion on the motorway. While the authors consider digital maps for implementation, it may be better to consider virtual segmentation. They propose a system that detects and distributes traffic congestion collaboratively. A GPS device is used to determine the current location, speed, and direction of vehicles at fixed intervals. The technology also utilizes location privacy and aggregation to reduce bandwidth usage.
Xu, et al. propose two methods of estimating the travel time of buses using the T-window average and N-window average, as well as a congestion indicator. This approach does not support vehicles that move in lane reserves [15].
Bauza, et al. [16] introduce a collaborative traffic congestion detection technique based on vehicle-to-vehicle communication and fuzzy logic without using sensors to detect traffic congestion.
Wedel, et al. propose a vehicle-to-X approach so drivers can share traffic information and optimize their routes based on that information [17].
Leontiadis [18] et al. propose a mechanism for crowd-sourcing traffic data and rerouting vehicles accordingly.
This paper aims to improve the Dijkstra algorithm for traffic management systems in urban cities to find the optimum path in case of a traffic jam via calculating and adding congestion level parameters to classic Dijkstra weight to avoid traffic jams by rerouting vehicles and then a comparison between improved Dijkstra and classic Dijkstra has been evaluated based on the performance metrics; related vehicles on the traffic congestion, average delay time, fuel consumption and CO2 emission.
The research contributions presented in this paper can be summarized as follows:
- Extensive literature review on traffic congestion detection and avoidance systems and modification Dijkstra algorithm.
- Enhancement Dijkstra algorithm that helps drivers reach their destination quickly and safely by suggesting optimal alternative routes to avoid road congestion on the road network.
- Building a road traffic mobility simulator using appropriate software for any city/county roadmap.
The rest of the paper is organized as follows: Section II provides traffic congestion measurement metrics; Section III provides traffic congestion handling methods, and Section IV is about traffic congestion avoidance handling. Sections V and VI provide methodology and simulation methodology sequentially. The simulation results and discussion will be explained in section VII. The last section VIII concludes the paper.
Traffic congestion measurement metrics
Traffic congestion can be measured in many ways, such as in [19].
Travel Time (TT): A vehicle's travel time is the time it takes to go from one point to another. Users can choose the optimal route to arrive at their destination in the shortest time possible with the help of this facility.
Speed: Within a limited time, vehicles move at an average speed. It is a vital factor in measuring traffic congestion. A variety of methods can be used to collect speed data from vehicles. A vehicle's speed can be determined based on the number of satellites orbiting the Earth via the GPS.
Level-of-Service (LOS): It measures the number of congestion suspensions on a particular road.
Delay: It is the time lost for vehicles when there is a traffic jam. Distance traveled is calculated by subtracting the arrival time from the trip's logical travel time.
Throughput: In each period, how many elements pass through the system? In other words, it is the productivity of a system. The throughput of a transportation system can be defined as the number of moving vehicles on the road during a given time (e.g., one hour).
Level-of-Congestion (LOC): The value of a pointer describes the condition of a specific street on the road network as a serial number between 0 and 1. This study has used the LOC metric to predict the traffic congestion status for road networks, starting from A (free congestion) to F (exceedingly congested), as shown in Table 1.
Traffic congestion handling
Traffic congestion has been classified into two main solutions: traffic congestion detection and traffic congestion avoidance handling [20].
Traffic congestion detection handling: There are two types: conventional detector and floating car data. This study uses floating car data handling to collect road data via 3G_4G technology to determine traffic congestion locations in road networks [21].
Floating car data detection: Floating Car Data (FCD), also called Probe Vehicle Data (PVD), provides real-time traffic information by tracking the vehicle via mobile phone or GPS, which serves as a mobile sensor node that regularly exchanges data with the traffic center. In addition to providing information about location, speed, and direction, this information is crucial to measuring, predicting, monitoring, and managing the traffic system and locating congestion.
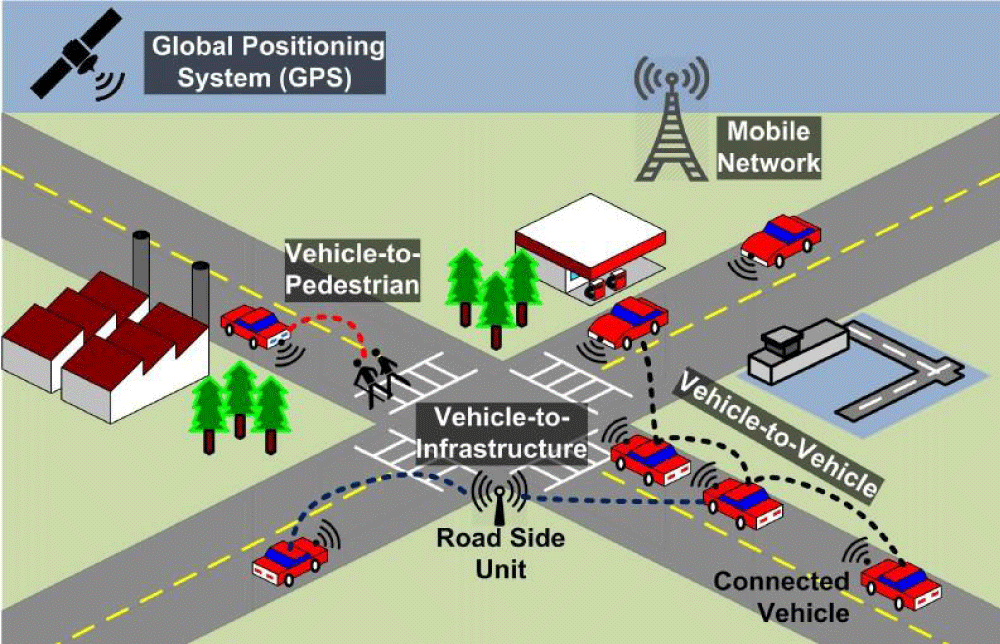
The FCD technique is classified into three types, as shown in Figure 2 [22].
− GPS-based FCD: GPS is a satellite-based navigation system that supports geolocation, speed, and time for vehicles. GPS is now embedded in many vehicles and provides high-quality traffic information for road traffic management systems, which is a crucial positioning technology for delivering information (speed, location, travel time) in real-time for advanced transportation systems. There are many advantages to using the GPS-based FCD method, including real-time tracking, travel time provision, effectiveness, and low maintenance costs in all types of weather [23].
− Cellular phone-based FCD: A cellular phone probe is an efficient way to gather real-time road information. In most vehicles, at least one mobile phone is a sensor for the road network. A cellular probe tracks a cell phone's movement on the road network to provide travel time and location information. The technique is beneficial since it doesn't require costly equipment installed on the road. Because of the increasing use of cell phones in vehicles, the accuracy of traffic road monitoring has dramatically improved [24].
− VANET-based FCD: Intelligent transportation systems can be enabled by Vehicular Ad Hoc Network (VANET) technology. There are two ways traffic data is exchanged in VANET, between vehicles (V2V) and between Vehicles and Infrastructure (V2I). The main objective of V2V communication is to detect traffic congestion and accidents, measure the level of congestion, provide traffic conditions through Inter-Vehicle Communication (IVC), and provide Internet access and entertainment. At the same time, V2I offers real-time information regarding traffic status and weather and suggests alternative routes to guide drivers to avoid bottlenecks [25].
Traffic congestion avoidance handling
The traffic congestion avoidance mechanism is considered one of the main functions of the Vehicle Route Guidance system, which assists drivers by providing helpful information regarding the traffic status. There are two main approaches: centralized and decentralized. This study has used the traffic flow and road-length variables to calculate the congestion level for each road, and the congestion threshold = 0.6. Choosing the accurate congestion threshold value is crucial as it impacts the performance of the service [26].
Methodology
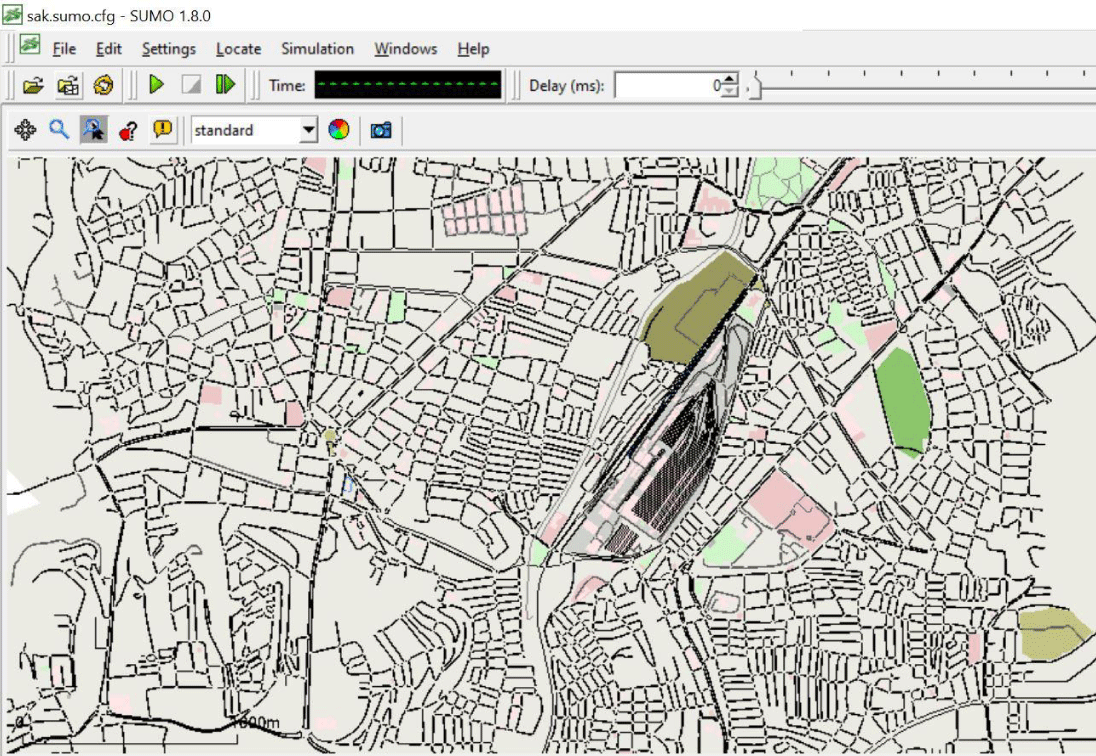
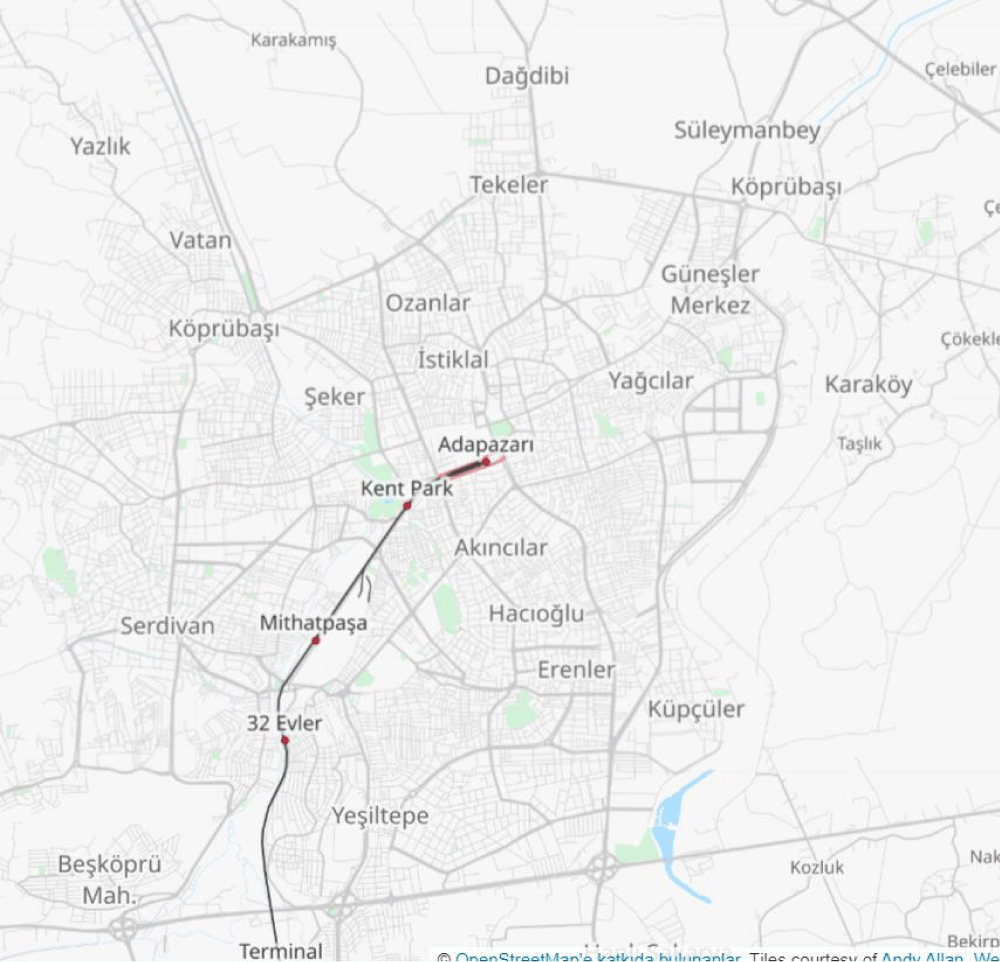
In this study, a traffic congestion level estimation of part of Sakarya City to get the optimal path of a vehicle on the road via used microscopic model simulation. This study distinguishes between two frameworks, the first of which includes OpenStreetMap and SUMO. It is OpenStreetMap's responsibility to build and maintain real databases for part of the Sakarya map, export these to SUMO, and then SUMO utilizes these real databases to generate traffic simulations of vehicles helpful in determining the location and state of traffic jams in a limited time, as shown in Figures 3,4. As a second framework, the Dijkstra algorithm and MATLAB are used to process data obtained from the SUMO output files and use this data to enhance the Dijkstra algorithm by adding congestion level parameters to traditional Dijkstra weight to reroute vehicles instead of causing traffic jams.
The main functionality of the improved Dijkstra algorithm is to alleviate traffic congestion by reducing travel time and minimizing fuel consumption and CO2 emission. The steps for an improved Dijkstra algorithm are as follows:
Step 1: Import SUMO output files, then use MATLAB to generate a chain of matrices;
Set congestion level parameters = 0.
Set THreshold Value (THV) =0.6.
Step 2: Select a vehicle with a route from the vehicle matrix.
Step 3: Calculate the traffic congestion level. Traffic congestion level = Traffic flow / Road Capacity
Then check the traffic congestion level against the selected vehicle route.
Step 4: for the initial point, if the traffic congestion level for the selected vehicle route is higher than (THV), then apply the improved Dijkstra model via rerouting the vehicle with consideration shortest path when choosing an alternative route; otherwise, use the classic Dijkstra.
Step 5: Move the vehicle in the road network depending on the time to reach the goal point.
Step 6: update the traffic congestion level and go to step 2 to select the next vehicle iterations. Until it finds optimal paths for all vehicles, output, and optimal path (lesser traffic congestion and shortest path) for all vehicles.
Step 7: End.
Simulation methodology
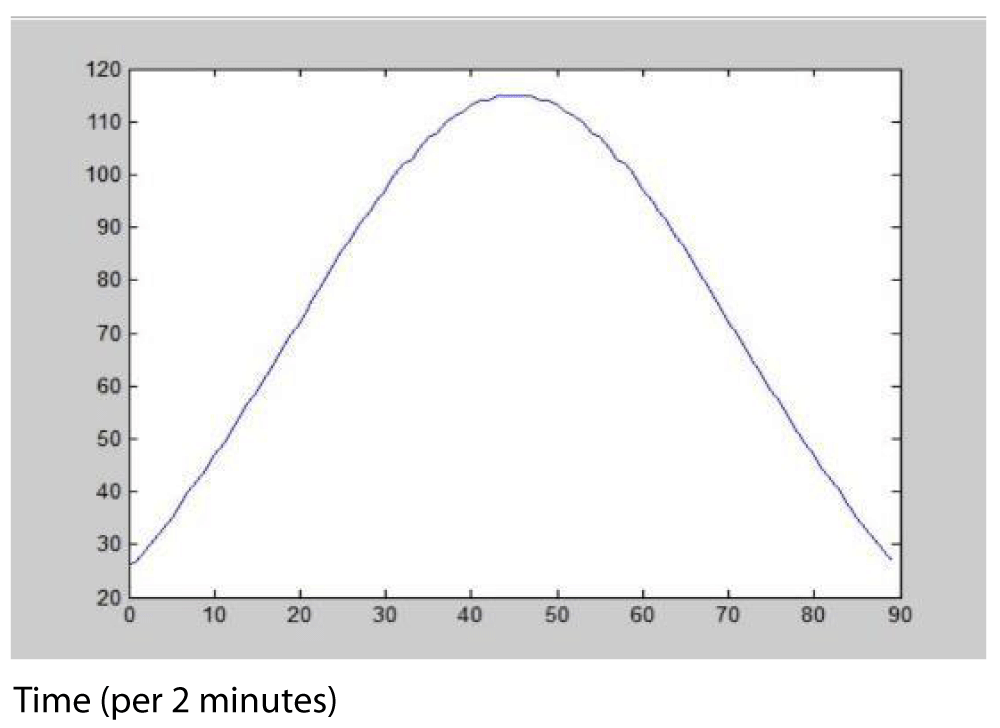
SUMO is used to simulate and evaluate the improved Dijkstra algorithm. The traffic map is extracted from the OpenStreetMap website as an OSM file. This study has used SUMO version 1.8.0 as a simulator platform to apply the scenarios on the part of Sakarya real roadmaps. SUMO depends on mobility information to run a system, such as road information, priority, the maximum speed allowed, the route of vehicles, and simulation time. To make all scenarios more realistic, the simulation time was assigned to three hours, the experiment run-time was divided into 90 intervals, and every 2 minutes updates the vehicle position.
On the other hand, generating new vehicles on the map is random, and vehicle distribution over each interval (90) is standard, as shown in Figure 5. Table 2 shows the simulation parameters for all scenarios of the selected road in the Sakarya map.
Simulation results and discussion
After simulated and obtained scenarios, the results are presented in graphs. The performance for both classic Dijkstra and improved Dijkstra algorithms have been evaluated in case of traffic congestion based on performance metrics: related vehicles in traffic congestion, average delay time, average fuel consumption, and average CO2 via using SUMO simulator, and the results have been analyzed using Excel. Table 3 compares the performance of the classic Dijkstra and the improved Dijkstra algorithm in traffic congestion cases.
Related vehicles
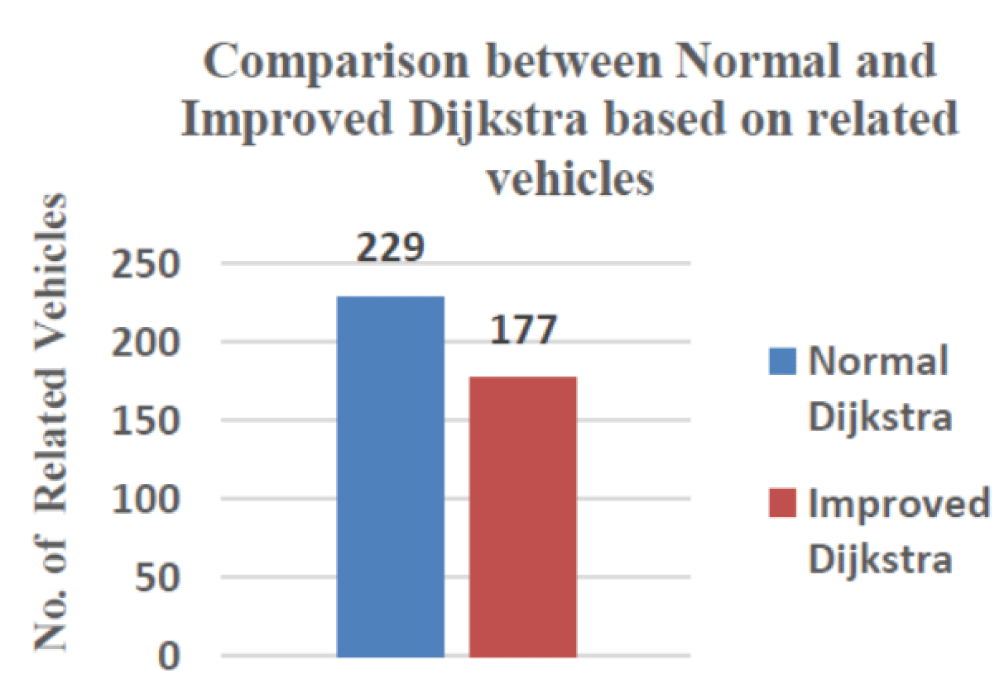
The number of affected vehicles in the traffic congestion has been measured by selecting the vehicles with a delay time greater than 270 seconds at their destination. Figure 6. Shows the results of the number of related vehicles for both classic Dijkstra and improved Dijkstra over the selected route network traffic congestion.
Figure 6 shows the proposed improved Dijkstra algorithm efficiency to reduce the number of related vehicles in traffic congestion that directly influences other parameters metrics such as (delay time, fuel consumption, and CO2 emission) that will be shown later, where the improved Dijkstra have (177) related vehicles. In contrast, the classic Dijkstra has (229) related vehicles.
The average delay time for vehicles is computed by applying Equation 1.
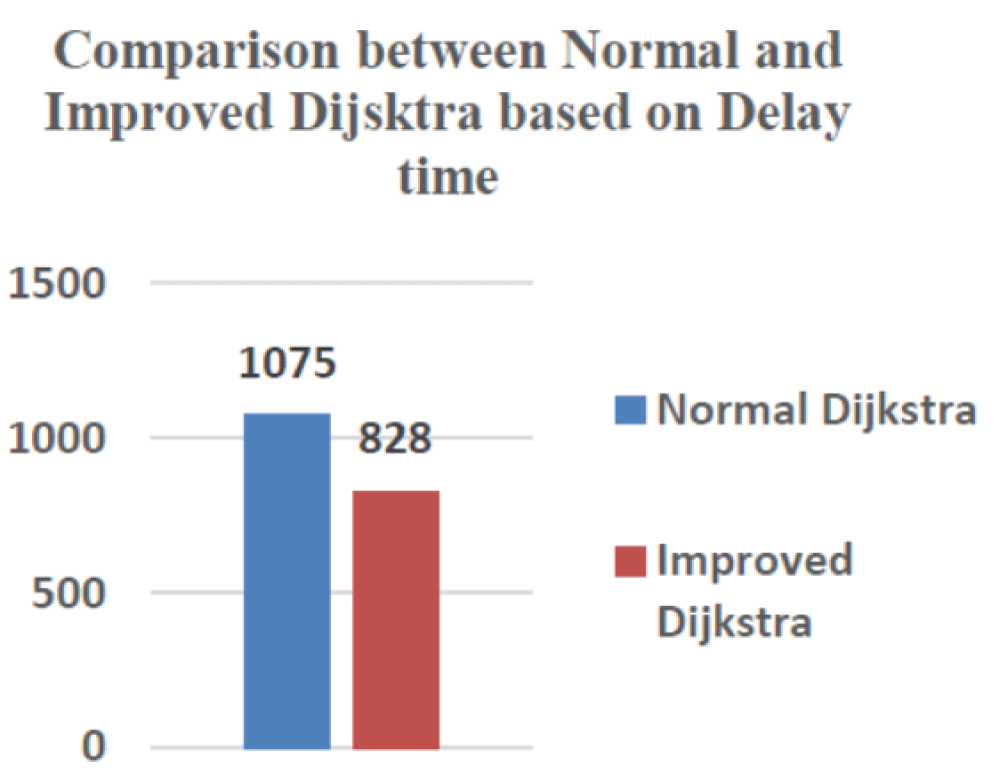
Figure 7 shows the average delay time for classic Dijkstra and improved Dijkstra over the selected route network traffic congestion.
Where:
Vi: Vehicle delay time
n: The number of related vehicles
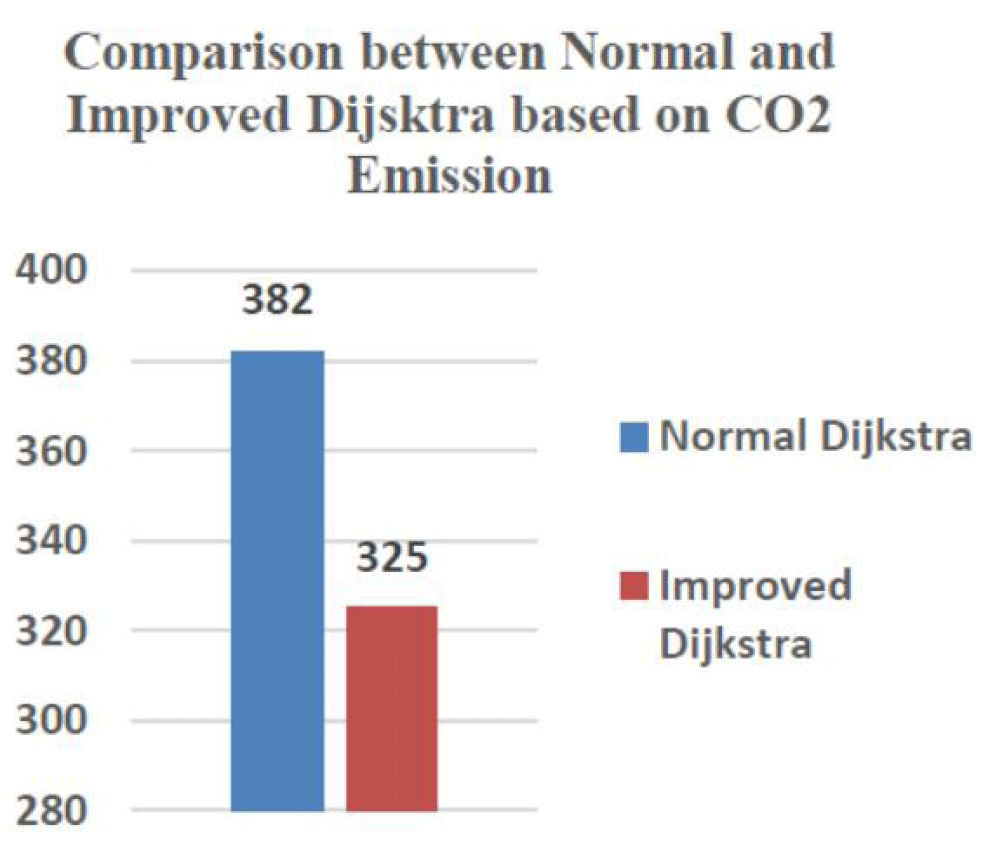
Average delay time: It is interesting to see from Figure 7 improved Dijkstra algorithm reduced the average delay time, which is 325,211 seconds, while the classic Dijkstra has 382.595 seconds. It is usual for the vehicle delay time to decrease traffic congestion by reducing the number of related vehicles in the congested routes.
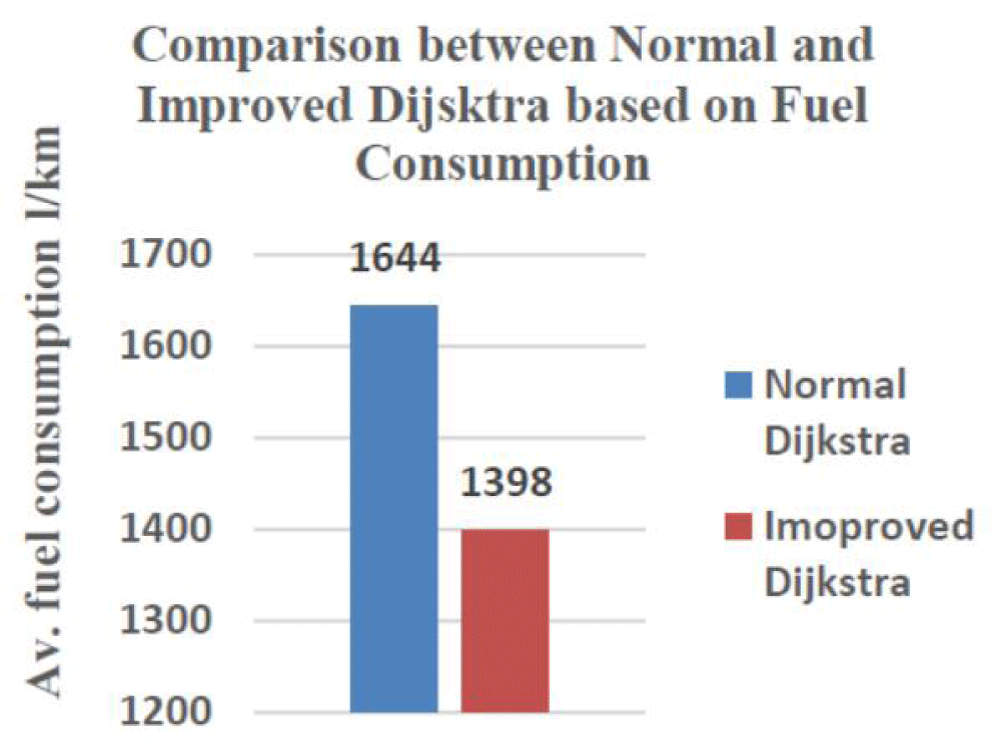
Average fuel consumption: It can be defined as the rate at which an engine spends fuel, expressed in units such as miles per gallon or liters per kilometer. This study used liters per kilometer. Figure 8 shows the fuel consumption results for classic Dijkstra and improved Dijkstra over the selected route network traffic congestion.
The results are related to the vehicle’s status, if it is moving or stopped, velocity, and the stopped time for connected vehicles during the simulation time. It can be seen from Figure 8 that the improved Dijkstra has reduced fuel consumption compared to classic Dijkstra for traffic congestion cases. The average fuel consumption in classic Dijkstra is 1644 l/km, and in the improved Dijkstra algorithm, it is 1398 l/km.
Average CO2 emission: It is the amount of CO2 that is emitted from natural and human sources. The unit of measurement is kg/km. Figure 9. Shows the results of the amount of CO2 emissions for both classic Dijkstra and improved Dijkstra over the selected road in traffic congestion.
CO2 emissions are positively associated with fuel consumption. The increase in fuel consumption results in more CO2 emissions. It can be seen from Figure 9 that the amount of CO2 emissions from vehicles has been reduced by applying improved Dijkstra on the related vehicles for the traffic congestion route in comparison with the classic Dijkstra.
Conclusion
With the increasing number of vehicles on the road network in the world, various problems have emerged, one of the most serious is traffic jams. This paper provides an efficient solution for traffic congestion that can effectively and practically reduce traffic congestion on the road network by improving the Dijkstra algorithm. The improved Dijkstra algorithm has added traffic congestion level to the classic Dijkstra to increase the performance of vehicles and reduce the average delay time. Overall, the proposed Dijkstra has improved performance is 23% for both related vehicles in traffic congestion and average delay time compared with the classic Dijkstra (with traffic congestion). On the environmental side, the improved Dijkstra dramatically reduces expenses and pollution, reducing average fuel consumption by approximately 15% for related vehicles in traffic congestion, and the amount of CO2 emission diminished by about 14%.
Future work will more focus on vehicle route guidance systems, which will play a vital role in alleviating traffic congestion by exchanging traffic information between vehicle-to-vehicle and vehicle-to-infrastructure.
The next step is to:
- Examine the performance of the improved Dijkstra algorithm in the real road traffic environment.
- Develop the proposed improved Dijkstra algorithm by integrating traffic congestion metrics such as speed, throughput, and Level-Of-Service (LOS).
- Employ new technology in vehicle route guidance systems, which will play a vital role in alleviating traffic congestion by exchanging traffic information between vehicle to vehicle and the vehicle to infrastructure.
Author contributions
A. Thabet developed the methodology and performed the analysis. A. Zengin supervised and improved the study. A. Thabet and A. Zengin wrote the manuscript together. A. Zengin proofread the manuscript.
The authors would like to thank the Iraqi Parliament Council for financial support.
- Liu Y, Cai Z, Dou H. Highway traffic congestion detection and evaluation based on deep learning techniques. Soft Comput. 2023;27(17):12249-12265. Available from: https://doi.org/10.1007/s00500-023-08821-6.
- Bhandari, Patel V, Patel M. A Survey on Traffic Congestion Detection and Rerouting Strategies. In: 2018 2nd International Conference on Trends in Electronics and Informatics (ICOEI). 2018;42-44. Available from: https://doi.org/10.1109/ICOEI.2018.8553965.
- Miller R, Huntsinger L. Climate Change Impacts on North Carolina Roadway System in 2050: A Systemic Perspective on Risk Interactions and Failure Propagation. Sustainable Cities and Society. 2023:104822. Available from: https://doi.org/10.1016/j.scs.2023.104822.
- Litman TA. Transportation Cost and Benefit Analysis Techniques, Estimates and Implications. 2nd ed. Victoria: Victoria Transport Policy Institute; 2011. Available from: https://www.vtpi.org/tca/tca00.pdf.
- Raymundo H, Reis JGM. How to Measure Performance Evaluation in Urban Passenger Transportation by Disutilities: Model and Application in the Ten Largest US Cities. J Urban Plann Dev. 2023;149(2):04023007. Available from: https://doi.org/10.1061/JUPDDM.UPENG-4083.
- Guo X. A Research on Blockchain Technology: Urban Intelligent Transportation Systems in Developing Countries. IEEE Access. 2023;11:40724-40740. Available from: https://doi.org/10.1109/ACCESS.2023.3270100.
- Malisan J, Marpaung E, Hutapea G, Puriningsih FS, Arianto D. Development of short sea shipping in the north coast of Java Island, Indonesia as a potential market. Transp Res Interdiscip Perspect. 2023;18:100760. Available from: https://doi.org/10.1016/j.trip.2023.100760.
- Jin J, Guo H, Xu J, Wang X, Wang FY. An end-to-end recommendation system for urban traffic controls and management under a parallel learning framework. IEEE Trans Intell Transp Syst. 2021;22(3):1616-1626. Available from: https://doi.org/10.1109/TITS.2020.2973736.
- Atalay, Ünal A, Çodur MY. Transportation policies in increasing traffic safety. Int Adv Res Eng J. 2018;2(2):104-108. Available from: https://dergipark.org.tr/en/pub/iarej/issue/38845/405064.
- Schrank DL, Turner S, Lomax TJ. Estimates of urban roadway congestion, 1990 (Research report, no. 1131-5). College Station, Tex.: Texas Transportation Institute, Texas A&M University System. 1993;69. Available from: https://static.tti.tamu.edu/tti.tamu.edu/documents/1131-5.pdf.
- Li Z, Liu P, Xu C, Duan H, Wang W. Reinforcement Learning-Based Variable Speed Limit Control Strategy to Reduce Traffic Congestion at Freeway Recurrent Bottlenecks. IEEE Trans Intell Transp Syst. 2017;18(11):3204-3217. Available from: https://doi.org/10.1109/TITS.2017.2687620.
- Deshmukh SM, Savant BN. Designing an optimized smart device in vehicle for detection and avoidance of traffic congestion. In: 2016 Conference on Advances in Signal Processing (CASP). 2016;33-36. Available from: https://doi.org/10.1109/CASP.2016.7746133.
- Schafer RP, Thiessenhusen KU, Wagner P. A TRAFFIC INFORMATION SYSTEM BY MEANS OF REAL-TIME FLOATING-CAR DATA. 2002. ITS World Congress. Available from: https://www.bibsonomy.org/bibtex/c7348e274b8e48a7e28b35cb8d6ebbb9.
- Terroso-Saenz F, Valdes-Vela M, Sotomayor-Martinez C, Toledo-Moreo R, Gomez-Skarmeta AF. A Cooperative Approach to Traffic Congestion Detection With Complex Event Processing and VANET. IEEE Trans Intell Transp Syst. 2012;13(2):914-929. Available from: https://doi.org/10.1109/TITS.2012.2186127.
- Xu Y, Wu Y, Xu J, Sun L. Efficient Detection Scheme for Urban Traffic Congestion Using Buses. In: 2012 26th International Conference on Advanced Information Networking and Applications Workshops. 2012;287-293. Available from: https://doi.org/10.1109/WAINA.2012.62.
- Bauza R, Gozalvez J, Sanchez-Soriano J. Road traffic congestion detection through cooperative Vehicle-to-Vehicle communications. In: IEEE Local Computer Network Conference. 2010; 606-612. Available from: https://doi.org/10.1109/LCN.2010.5735780.
- Wedel JW, Schünemann B, Radusch I. V2X-Based Traffic Congestion Recognition and Avoidance. In: 2009 10th International Symposium on Pervasive Systems, Algorithms, and Networks; 14-16 Dec. 2009;637-641. Available from: https://doi.org/10.1109/I-SPAN.2009.71.
- Leontiadis G, Marfia G, Mack D, Pau G, Mascolo C, Gerla M. On the Effectiveness of an Opportunistic Traffic Management System for Vehicular Networks. IEEE Trans Intell Transp Syst. 2011;12(4):1537-1548. Available from: https://doi.org/10.1109/TITS.2011.2161469.
- Seong, Kim Y, Goh H, Kim H, Stanescu A. Measuring Traffic Congestion with Novel Metrics: A Case Study of Six US Metropolitan Areas. ISPRS Int J Geo-Inf. 2023;12(3):130. Available from: https://doi.org/10.3390/ijgi12030130.
- Pi M, Yeon H, Son H, Jang Y. Visual cause analytics for traffic congestion. IEEE Trans Vis Comput Graph. 2019;27(3):2186-2201. Available from: https://doi.org/10.1109/TVCG.2019.2940580.
- Kiautha M. A study to measure the accuracy of speed data reported by floating car data in rural areas. 2023. Available from: https://scholar.sun.ac.za/server/api/core/bitstreams/785a6448-fc29-4c39-9a75-d6e3eb66b8b0/content.
- Xie G, Hoeft B. Freeway and arterial system of transportation dashboard: Web-based freeway and arterial performance measurement system. Transp Res Rec. 2012;2271(1):45-56. Available from: https://doi.org/10.3141/2271-06.
- He Y, Hofer B, Sheng Y, Yin Y, Lin H. Processes and events in the center: a taxi trajectory-based approach to detecting traffic congestion and analyzing its causes. Int J Digit Earth. 2023;16(1):509-531. Available from: https://doi.org/10.1080/17538947.2023.2182374.
- Janecek, Valerio D, Hummel KA, Ricciato F, Hlavacs H. The cellular network as a sensor: From mobile phone data to real-time road traffic monitoring. IEEE Trans Intell Transp Syst. 2015;16(5):2551-2572. Available from: https://doi.org/10.1109/TITS.2015.2413215.
- Souki O, Djemaa RB, Amous I, Sedes F. Monitor and Analyze Sensor Data from a Connected Vehicle Thanks to Cloud Edge Computing. In: Computer Science On-line Conference 2023. Springer. 2023;667-683. Available from: https://doi.org/10.1007/978-3-031-35317-8_60.
- Noussaiba M, Razaque A, Rahal R. Heterogeneous Algorithm for Efficient-Path Detection and Congestion Avoidance for a Vehicular-Management System. Sensors. 2023;23(12):5471. Available from: https://doi.org/10.3390/s23125471.
Article Alerts
Subscribe to our articles alerts and stay tuned.
 This work is licensed under a Creative Commons Attribution 4.0 International License.
 Help ?

PTZ: We're glad you're here. Please click "create a new query" if you are a new visitor to our website and need further information from us.
If you are already a member of our network and need to keep track of any developments regarding a question you have already submitted, click "take me to my Query."


 Save to Mendeley